 Coingecko
 connects crypto prices with supply, market activity, and historical data
Coingecko aggregates cryptocurrency market data so readers can compare prices, market capitalization, trading activity, and historical performance across tracked assets. Coin pages connect those figures with exchange markets and supply information. Watchlists and portfolio tracking organize selected assets, while the API supplies structured data for applications. Each view answers a different question: an aggregate price describes the broader tracked market, an exchange quote describes one venue, and a portfolio valuation applies prices to recorded holdings.
Coin pages, market comparisons, and discovery
Coin pages bring an asset's price, supply figures, market capitalization, and trading markets together. Broader market views support comparisons across assets, categories, and the tracked crypto market. Historical charts add the time dimension a current snapshot lacks. These functions connect through the same underlying asset identity, although their measurements describe different things. Price measures value per unit; volume measures trading activity over an interval; market capitalization incorporates circulating supply.
Category data groups assets for thematic comparisons, while trending searches surface attention within the platform. Neither category membership nor search interest establishes future performance. A discovery view helps identify something to examine; the coin's market and supply data provide the substance of that examination. Changing the comparison currency or observation period also changes what a performance comparison means.
The inputs behind an aggregated price
The published coin price combines eligible trading pairs after currency normalization and outlier filtering. A trading pair represents a market exchanging one asset for another.
Prices arrive in different quote currencies. The aggregation methodology uses a Bitcoin Price Index and currency conversion relationships to make those inputs comparable. It then selects eligible tickers and removes prices its filters identify as anomalous. The outlier method varies with the number of available tickers, so sparse markets require different treatment.
A volume-weighted average gives greater influence to remaining tickers with greater trading volume. The published value therefore need not match any single exchange's latest trade.
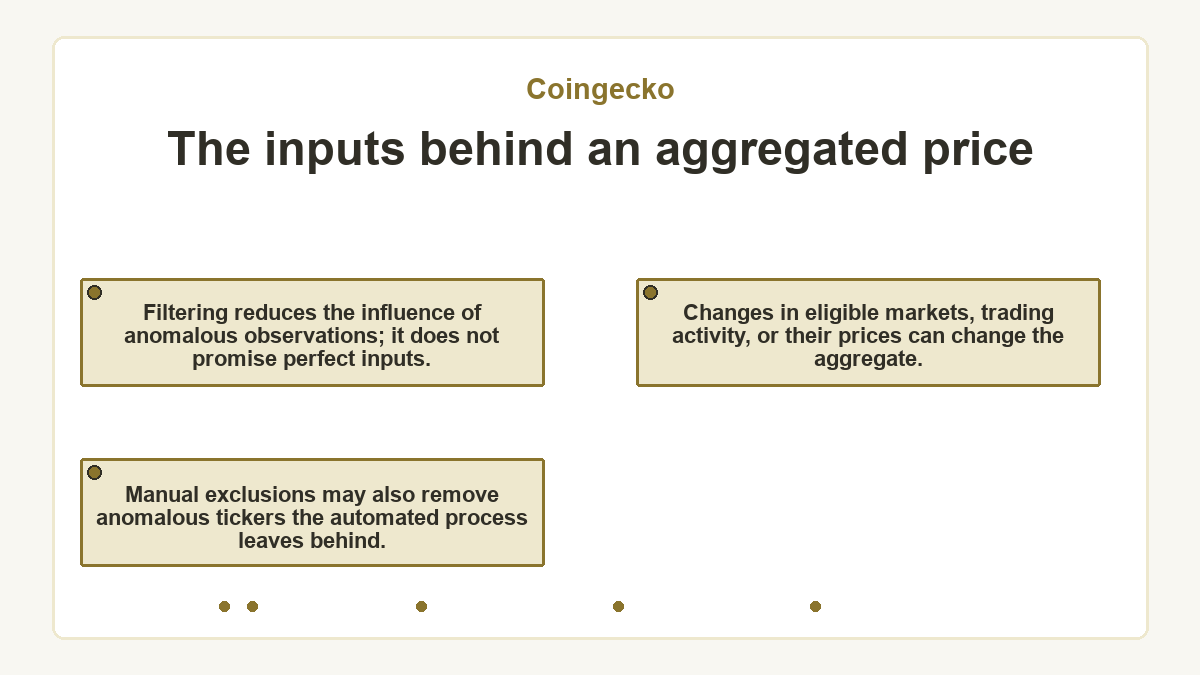
Filtering reduces the influence of anomalous observations; it does not promise perfect inputs. Manual exclusions may also remove anomalous tickers the automated process leaves behind. Changes in eligible markets, trading activity, or their prices can change the aggregate.
Market capitalization and the meaning of size
Market capitalization combines the price of one unit with the amount considered circulating. This makes it more informative for comparing asset size than unit price alone. Market capitalization equals price multiplied by circulating supply. A low unit price does not establish a low overall valuation, because the circulating quantity may be large.
Market capitalization also differs from money invested and money available to withdraw. It applies a quoted price across circulating units. It does not add up historical deposits or measure the proceeds selling every unit would produce. Price changes can alter the calculated valuation without an equivalent amount of new capital entering the asset.
Relative rankings can move when either price or circulating supply changes. A comparison therefore needs compatible valuation definitions and observations from comparable times.
Supply definitions behind valuation differences
Supply figures describe different portions of an asset's issuance. Total supply counts minted units after permanent burns; maximum supply describes a coded issuance ceiling where one exists. Circulating supply excludes units the methodology treats as locked or unavailable for circulation. These quantities answer different questions and should retain their separate labels.
Fully diluted valuation, or FDV, applies the present price to the relevant total or maximum supply. Its meaning depends on which supply basis the displayed metric uses. It describes a valuation calculation rather than a forecast of what future issuance will be worth. A difference between market capitalization and FDV makes the supply assumptions material to the comparison; it does not specify when tokens will become available or how their price will respond.
Why does the displayed price differ from an exchange quote?
The displayed price aggregates multiple eligible markets, while an exchange quote reflects that venue's market conditions and observation time. Differences can also arise from the quote currency, spread, and available liquidity. An aggregated reference price therefore answers a broader question than the price available for a particular order.
The spread is the gap between available buying and selling prices. Order book depth describes quantities available at surrounding price levels. A quoted market with little depth may produce a different average execution price as an order consumes available liquidity. Trading volume provides another measurement, but a large reported volume alone does not establish deep liquidity. For an execution decision, the relevant venue's order information has a different purpose from the aggregate coin price.
Historical comparisons and their time boundaries
Historical data connects a coin's price, market capitalization, and trading volume across time. Date snapshots answer what the dataset recorded at a specified boundary; chart series describe movement over an interval. These outputs are related, but their timestamps and sampling need to match the question. The historical date endpoint returns a snapshot at midnight UTC for the requested date.
Chart coverage and granularity depend on the endpoint, available history, and subscription entitlement. A longer requested period does not create observations preceding data collection. Price, market capitalization, and volume series also retain different meanings even when they share timestamps. A comparison across assets needs the same quote currency and compatible intervals, especially when interpreting percentage changes or apparent turning points.
Network and pool identity in onchain data
Onchain analytics provides token and liquidity pool information through network identifiers and contract addresses. It extends market research into decentralized exchange activity, including pool liquidity, trades, and candlestick data. A candlestick summarizes the opening, highest, lowest, and closing prices within an interval; accompanying volume describes activity during that interval. Pool data describes a specific trading location, while token data can combine activity across pools.
The network and address determine which object a request describes. A token address and a pool address identify different objects, even when both relate to the same asset. Pool responses can include base and quote token details, which help establish what the quoted ratio measures. An unverified market capitalization may appear as a missing value even when other pool data exists. Substituting FDV for that missing value would change the measurement.
Trust Score and exchange comparisons
Trust Score evaluates spot exchanges using liquidity, cybersecurity, regulation, incidents, and proof of reserves. The combined assessment reflects an exchange's standing relative to scored peers. Its meaning therefore extends beyond reported trading volume, and a change in the score need not correspond to a single market statistic.
Trading-pair assessments and exchange assessments operate at different levels. A pair describes a particular market; an exchange assessment considers the venue more broadly. Neither substitutes for the available liquidity of a specific order. Derivatives exchange rankings use reported open interest and trading volume rather than the spot exchange Trust Score framework. Comparisons need to preserve that distinction instead of treating every exchange ranking as the same measurement.
Watchlists and recorded holdings
Watchlists organize assets of interest, while portfolio tracking combines recorded transactions and holdings with market data to display value and profit or loss. These records do not hold the assets themselves. Editing a portfolio entry changes the tracking record; buying, selling, or withdrawing assets requires the service holding or trading them. A displayed portfolio balance therefore cannot establish custody or the completion of a transfer.
Structured data through the API and MCP
The API, or application programming interface, returns structured market data for software. Its functions include price queries, bulk market comparisons, historical observations, and global metrics. Requests identify the asset and specify the required parameters; the chosen endpoint determines the response fields. A bulk comparison and a single historical snapshot serve different needs even when they concern the same coins.
Model Context Protocol, or MCP, exposes data tools to compatible AI applications. The hosted keyless option uses shared limits; authenticated access depends on the API plan. Local deployment provides another integration option and requires supported credentials. MCP changes how an application requests data, while the underlying API supplies the market observations.
Transport support, authentication, and available tools determine whether a particular client can use the selected connection. Tool calls can trigger multiple API requests, which count toward applicable limits and credits. An application's successful connection establishes access, but the returned asset identity, currency, and observation time determine whether its answer addresses the requested market question.
A price lookup reconciled before a spreadsheet update
A price import needs the same asset identity and quote currency as the destination record. The simple price response can include its last update timestamp, allowing the import to retain the observation time alongside the value.
In this hypothetical example, a spreadsheet row represents a tracked coin in a selected supported currency. The chosen asset, currency, returned price, and timestamp are hypothetical inputs. The reader wants to populate that row without overwriting its existing value until the response matches. The spreadsheet must support reading the structured response and preserving its currency label.
The reader resolves the coin's unique API identifier, requests its price in the selected currency, and includes the update timestamp. The response goes into a temporary cell. Comparing the returned identifier and currency with the destination row reveals whether the import belongs there. An identifier mismatch, a missing price or timestamp, or an incompatible currency leaves the existing cell unchanged.
Once those fields match, the reader saves a separate copy of the existing destination record, then copies the returned price and timestamp into it. Comparing the saved cells with the response confirms completion: the row contains the requested observation with its currency and time. The original value remains available for reversal. A later request may return a different price; it represents a new observation rather than evidence the earlier import failed.
What readers ask about Coingecko
Can a price alert buy or sell a coin automatically?
A price alert sends a notification when the tracked price reaches the selected threshold; it does not place a trade. Custom price alerts let you choose a price or a percentage setting. An alert concerns the tracked market value, while an executable order belongs to the venue where trading takes place.
Why can a coin have a price without a circulating supply figure?
A coin can have observable trading prices while its circulating supply remains unverified. Price collection and supply verification use different inputs. When the platform cannot verify circulating supply, it marks the figure as unavailable. That missing quantity also limits the calculation of circulating market capitalization; it does not mean the asset has no circulating units.
Does a trending coin mean its price is rising?
A trending search position reflects search interest rather than a requirement for positive price performance. The trending search endpoint identifies coins attracting attention during its stated observation window. Price change is a separate field with its own currency and interval. A coin can attract searches because its price has fallen, so attention and performance should remain separate interpretations.
How can an incorrect historical chart point be reported?
To report a suspected error in price, market capitalization, volume, or an extreme historical value, submit a chart cleanup request through CoinGecko's support ticket form. Useful details include the affected asset, the UTC time range, the market feeding the questionable data, and a screenshot. Review concerns data integrity; a fundraising price or preferred exchange quote does not establish a replacement for the aggregated market record.
Is free API access sufficient for historical research?
Free API access is sufficient only when its available endpoints, history, and usage allowance cover the intended research. A Demo account provides an API key, while paid plans provide different entitlements. The relevant comparison is the required time range and request volume against those entitlements, rather than assuming every historical function has identical access.
Last updated -